Termtap - Debug Your Backend
Author: Hayden Hargreaves
Published: 05/11/2026
Problem
Backend API debugging is still largely guesswork in 2026. Web engineers get rich browser DevTools; server engineers get partial logs and speculation. Backend engineers lack a simple, reliable way to see outbound API traffic from their local apps or CLI tools. Browser tools do not cover this workflow, and debugging using logs is incomplete and slow. As a result, developers spend too much time guessing what requests are sent, what went wrong, what responses they got and where integration breaks. Backend, terminal-first engineers are even worse off. Heavy, industrial tools exist, but they do not suit the needs of a developer who does not want to leave their terminal. They need a local, low-friction tool that exposes HTTP/S behavior without requiring code changes, dashboard hopping or industrial overhead.
What is Termtap
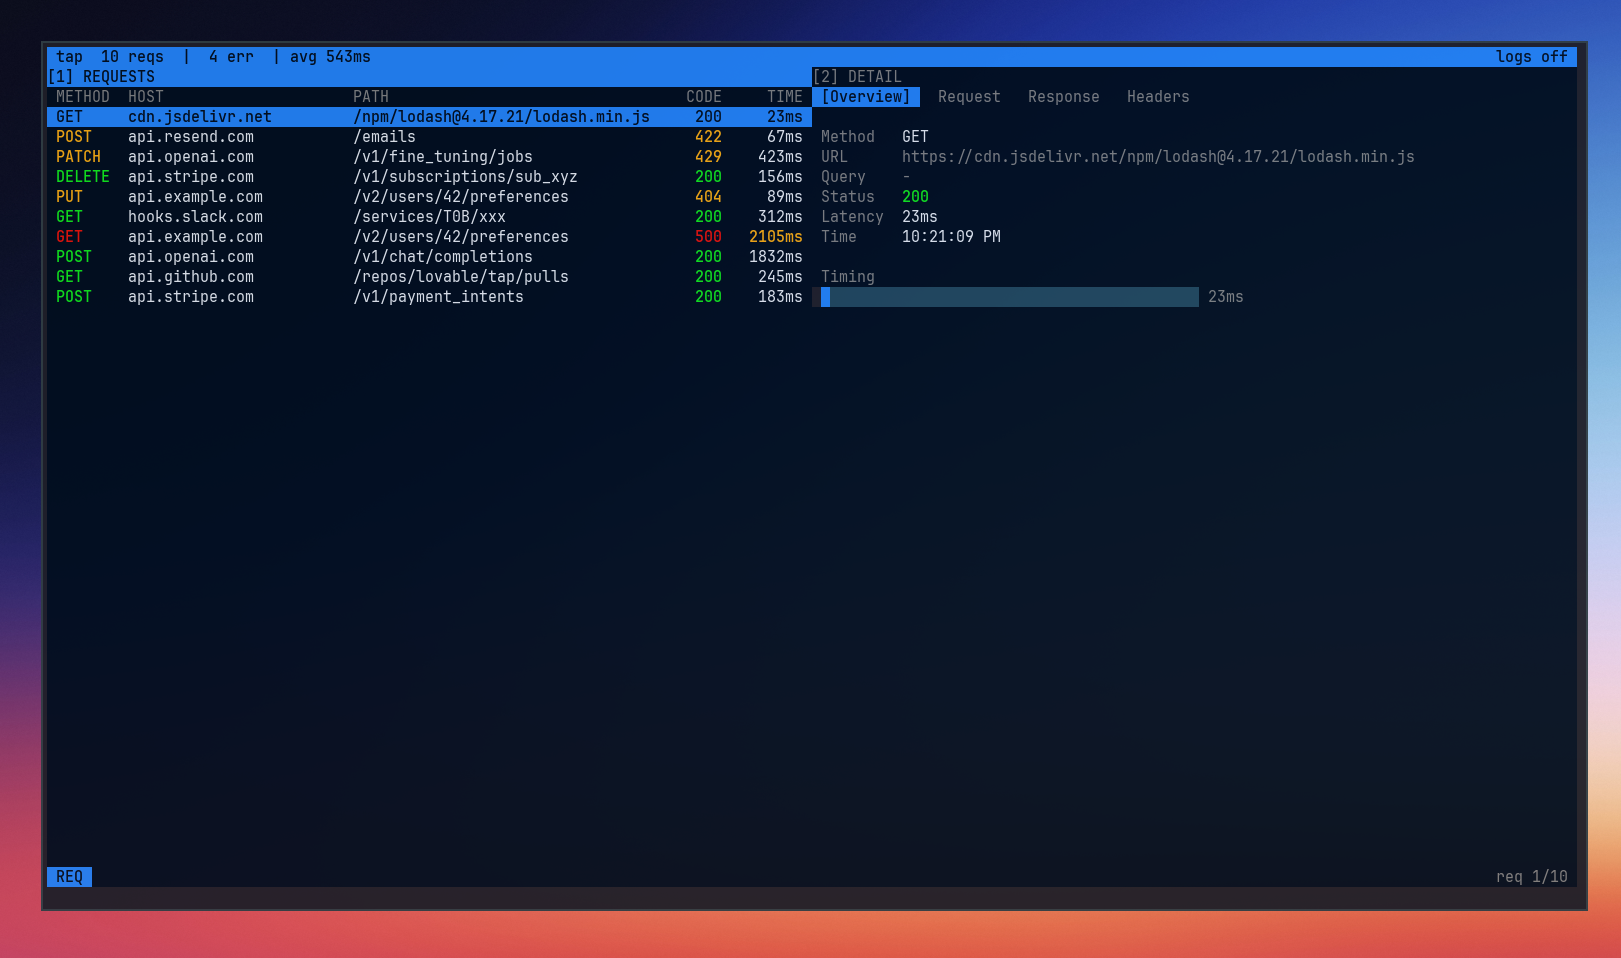
Termtap is a terminal-based proxy inspector for backend engineers. You run your code using the tap CLI and Termtap shows outbound HTTP/S traffic
in real time. You can see requests, responses, status codes and failures - all without changing your code.
Termtap was built for local iteration, not enterprise observability. Instead of dashboards, agents and long setups, Termtap is small and direct: a single command, immediate visibility with a keyboard-driven workflow. If you live in the terminal and need to understand what your app is sending over the network, Termtap is the quickest way from "something is wrong" to "here's exactly why."
How it Works
Termtap wraps the command you run, starts a local proxy and streams HTTP/S traffic into a TUI.
Wrap your command
Run your app normally, just prefixed with the tap CLI.
tap run -- go run .
Termtap launches your process with proxy environment variables set, so outbound requests flow through Termtap automatically.
Capture traffic in real time
While your app runs, Termtap captures request/response metadata and timing information as they occur. You can immediately see what endpoints are hit, what methods were used, response status and where failures occur.
Inspect HTTPS locally
For HTTPS inspection, run the cert command.
tap cert
Termtap creates (or reuses) a local CA, shows where it lives, and prints trust instructions for your OS. Once trusted, HTTPS traffic can be inspected locally on your machine. More details regarding certs and why we need them can be found in the docs.
Investigate the terminal
Use keyboard-first navigation to move through requests, inspect details, and filter with search. No browser tabs, no dashboards, and no instrumentation changes in your app code.
Why Now
With microservices on the rise, applications have added layers of communication between systems that might not need them. Debugging large webs of microservices is cumbersome without a strong observability tool. Termtap provides a simple way to see what each service is "seeing" and "saying," allowing a developer to find the cause of issues faster.
Project State
Termtap is currently in beta; usable today, however, it is intentionally narrow and improving quickly through real developer feedback.
Right now, Termtap is strongest for local debugging of outbound HTTP/S traffic from terminal-run apps. The core workflow is stable: wrap a command, observe live traffic, inspect failures, and iterate without changing application code.
This is not a polished, enterprise-grade observability platform. Expect rough edges, missing features, and occasional breaking changes as the tool evolves. That tradeoff is deliberate: optimize for speed, focus, and a tight terminal-first workflow over broad surface area.
If you’re a backend developer who lives in the terminal and wants to shape the direction of the tool, you’re the ideal early user. Feedback, edge cases, and bug reports are especially valuable right now.
Who it's For
Termtap is built for backend developers who debug API integrations from the terminal and want immediate visibility into outbound HTTP/S traffic.
It is for you if:
- You run services, scripts, or CLI tools locally and need to see real requests in real time
- You prefer terminal-native workflows over browser tabs and dashboards
- You want low setup and no app instrumentation just to debug network behavior
- You care more about fast feedback loops than enterprise observability features
It is not for you if:
- You need a full production observability platform with team-wide dashboards and alerting
- You want long-term analytics, tracing infrastructure, or hosted telemetry pipelines
- You are looking for a GUI-first workflow as your primary interface
- You expect a fully polished, zero-edge-case product today
Termtap is intentionally opinionated: local-first, terminal-first, and focused on the shortest path from “something failed” to “I can see exactly why.”
What's Coming
The goal of Termtap is to remain lightweight and simple, so the feature list is small. However, there is room for additions and improvement. Reliability is the focus, but meeting user needs comes first. Some possible features include request replay, payload modification, standalone proxy functionality or multi-process support.
How You Can Use It
I’m looking for 15–20 terminal-first backend engineers to try Termtap on real integration bugs.
If that’s you:
- install from GitHub Releases
- run it on one failing API flow
- tell me what was confusing, missing, or slow
GitHub: https://github.com/haydenhargreaves/termtap
Docs: https://termtap.dev/docs